
Many -if not all- organizations have a risk management policy, including a risk control framework in place and often use Excel or a web-based tool to capture and manage identified risks with associated controls.
However, few organizations link their risk management efforts with the level of risk they are prepared to accept (risk appetite) via key performance metrics to identify risk related trends and integrate this in the company’s (monthly) reporting cycle. If done properly, risk management will have more added value, and will become part of day-to-day operations and more embedded in the organization. I call this performance-based risk management.
In this context “performance-based” means key performance indicators are linked to the risk appetite via pre-defined thresholds / risk tolerances. The drivers of these indicators are measured and periodically verified to identify if they reach or even breach the thresholds. This indicates whether a risk is materializing or not (transforming key performance indicators into key risk indicators). I strongly believe this approach can be used in many industries and governmental and non-profit organizations.
In this article I set out a pragmatic and simple way to implement performance-based risk management. Large companies will probably have a performance-based risk strategy in place and might use techniques that are more advanced than described in this article. I am very interested to learn more about this and look forward to your feedback. Other companies might be less mature on their risk management techniques so hopefully this article is of use to them.
Context
The organizations where I introduced performance-based risk management tools were mid-sized companies with a company size of approx. 300-1000 employees. The maturity on risk management was relatively low and risk management related activities were scattered throughout the organization. A centralized risk management function was not always present. The existing risk management activities were mainly focused on “traditional” risk management activities such as internal control activities with a backward-looking focus and limited dynamic interaction and / or involvement with the business.
To have a more comprehensive and structured way in executing risk management, I was engaged as an interim risk manager / consultant to implement enterprise risk management.
COSO ERM
My implementation approach is usually based on COSO ERM (2004 version). After defining the goals and objectives of the organization, I created a risk universe in cooperation with the business (based on interviews but also annual reports, audit reports and incident reports) with a variety of internal and external risks that could threaten the organization. In addition, I determined likelihood and impact criteria for the risk assessment. With the risk universe, I had several workshops with managers of all departments to identify the most relevant risks in their area of responsibility. This resulted in approx. 50 risks which served as the basis for the risk assessment with the company’s Board.
The risk assessment led to the top risks which were further analysed on root causes, consequences and control activities. To have more interactive meetings, I executed “mini-workshops” with 2-3 employees where we analysed the risks via MindMapping. MindMapping is a graphical way to represent ideas and concepts. It is a visual thinking tool that structures your information which helps in better analyzing, comprehend and generate new ideas. My experience is that this interactive technique generates much more information than for example an interview.
After creating the risk control framework based on the above, I started with the key risk indicators. Everything is documented in Excel, so both the risk control framework and the KRI dashboard are Excel based.
An important note is that this article is not intended to neglect the concepts described in the recently issued 2017 ‘COSO ERM – Integrating with strategy and performance’. Obviously, this edition of COSO zooms in on the relationship between performance and risk management and highlights the importance of considering risk in both the strategy-setting process and in driving performance. The purpose of my article is to provide a practical way to relate performance measurement with risk management.
Key Risk Indicators / relation with KPI’s
As indicated above, key risk indicators (KRI’s) are essentially key performance indicators but aimed at risks and linked with the company’s risk appetite via risk tolerances. In this section I will explain how I determined the KRI’s and how they were used. I will also give some examples.
It is my strong believe that it is most effective to use methods and tools already in place, instead of creating new items and reinventing the wheel. This also applies to KRI’s. In one of these organizations, the use of KPI’s was widespread. As such I started with few key risks and determined which KPI was related to the risk and could also serve as a KRI. In some cases, obviously the KRI has to be determined from scratch when there is no associated KPI available. Determining KRI’s should always be done in close cooperation with the risk owner since he/she will ultimately also be the KRI owner.
After determining the KRI in discussion with the risk owner, the risk owner determined tolerances which must be in line with the risk appetite. When the risk appetite is low, the tolerances are set very strict, and with a high risk appetite the tolerances are wider. You can also highlight the current number when it exceeds a threshold or not (using a traffic light indication) and whether it increased or decreased and show a positive or negative trend (depending on the KRI). This is a very good way to operationalize your risk appetite and to make it very concrete and tangible.
Create mini graphs
Everybody knows that a picture says more than a thousand words. Therefore, it is very useful to represent your data via a graph. In this way, trends are easily to identify. When you also include graphs that show the tolerances, you can immediately see whether the KRI exceeds a tolerance.
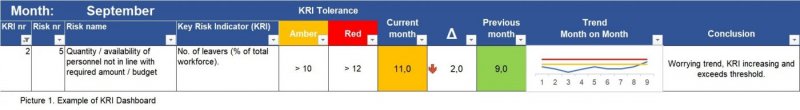
Example of a KRI dashboard
The following picture shows an example of a KRI dashboard. The risk is unavailability of personnel, and the associated KRI is the number of leavers as percentage of the total workforce. As you can see, the tolerance is set on 10% (amber) and 12% (red), this should be in line with the company’s risk appetite. The trend month-on-month shows that the KRI is throughout the year below the threshold, but shows a worrying increasing trend which even exceeds the threshold in September.
Make the KRI’s actionable
To ensure this exercise really has added value and to create useful management information, it is crucial to attach a conclusion and action to the KRI. Based on the data and the associated trend, you should look for root causes that drives the risk exposure. When the trend starts exceeding the thresholds it is important to determine, in cooperation with the risk owner, appropriate actions to bring the risk exposure back within acceptable tolerances. It is important to note that the prime responsibility to manage the risk lies with the risk owner.
In this example of number of leavers increasing, you should determine why the number increases. This can be decreasing working conditions, personnel getting dissatisfied or a labor market that is increasingly competitive making it easier for employees to switch jobs. An increasing number of leavers can obviously have a number of reasons and risk mitigating actions. An employee satisfaction survey would be a good starting point, but additional actions might be required.
Who uses KRI’s
It is important to recognize your audience. Obviously, the risk manager is one of the primary users of the KRI dashboard as part of his oversight role with respect to risks. However, it is also important that the dashboard is shared with Management and the Board. Especially Managers have primary responsibility to act when risks exceed thresholds.
How to collect data
An important element of KRI’s is the source data. When KPI’s are already in use, this should be easy. You just make use of the data that is already captured. However, when you determine KRI’s from scratch, this can be quite cumbersome. You have to agree with the risk owner where and how to get the source data. Sometimes the data is easily available via a report that is already send out but in other cases one needs to start capturing the data.
Lessons learned
During the implementations of performance-based risk management I executed, I obviously ran into some challenges. The following items are my lessons learned:
Use what is already available: Don’t try to reinvent the wheel, it often does not work and is a waste of effort. If there are already KPI’s available, try to link them with risks and attach thresholds to them. Making up KRI’s from scratch can be very cumbersome since usually there is also no historical data. Unfortunately, sometimes there is no other way then creating KRI’s from scratch. In those cases, you can determine if there are other metrics to use. In one case I saw, a Manager reported certain metrics on a monthly basis which was easily transferable into a KRI.
Create SMART, but simple KRI’s: Obviously KRI’s should be specific, measurable and have a time component. But don’t make it over-complex since users probably will not understand and it might be difficult to capture relevant data.
Cooperate with the risk owner and the business: Creating a KRI dashboard (just like creating the entire risk control framework) is obviously not the sole responsibility of the risk manager. This should be done in close cooperation with the risk owners and the business. They are the experts in their field and best able to identify threats, risks and mitigating control activities and therefore provide valuable input. More involvement of the business also enhances the buy-in and awareness for the KRI dashboard and risk management in general.
Clear and concise agreements with the supplier of data: As indicated, without proper source data there is no use for KRI’s. As such it is crucial to make good arrangements with the people who supply your KRI data on timing and way of delivery. Your KRI dashboard has to be issued on time, so your source data as well.
Explain, explain, explain: The concept of KRI’s might not be rocket science, but for some it can be difficult to understand. When you work daily with risk control concepts, you tend to forget that the users of your reports and dashboard might not, so extensive explanation on the KRI’s is needed.
Split the KRI’s in BU’s or departments: It is sometimes useful to split the KRI’s per department or business unit to have more insight and to provide more detailed information to the responsible manager. This is also relevant when you report your KRI’s per BU.
Assign risk and KRI owners: Ownership is key! Without ownership and accountability, the only owner of the KRI is the risk manager while your aim is to involve the business. When the ownership is unclear, it is also difficult to retrieve the proper source data for your KRI’s.
Integrate with monthly reports: To ensure it becomes part of normal business, integrate your KRI dashboard with other management reports. This will ensure appropriate attention for your KRI’s and risk management in general.
Spend enough time on thresholds. The KRI thresholds operationalize your risk appetite. It is crucial to set appropriate thresholds that reflect the company’s risk appetite so consider these properly. To be able to set meaningful thresholds, it might be useful to first determine the trend of your KRI (although this is not always possible for new KRI’s obviously).
KRI’s in your organization
With the approach set out above, it is interesting to see how other organizations would implement performance-based risk management. Consider the key risks in your organization and determine a proper KRI. As discussed, try to use what is available, for example a KPI what is already captured. Attach sensible thresholds to it and make the KRI trend visible by creating a graph based on historical data.
If this concept caught your attention, INTERMEDIATE can assist you by providing qualified interim professionals in this area on a short notice.
